
Gold’s correlation with the stock market is defined as the statistical relationship between gold price movements and equity index returns, most commonly measured against the S&P 500. Historically, this correlation has sat near zero, meaning gold and stocks move independently of each other. That independence is precisely what makes gold valuable as a portfolio diversifier. Understanding how gold correlates with the stock market in 2026 matters more than ever, because recent data shows this relationship is shifting in ways that challenge long-held assumptions about gold’s role as a safe haven.
How gold correlates with the stock market: the historical baseline
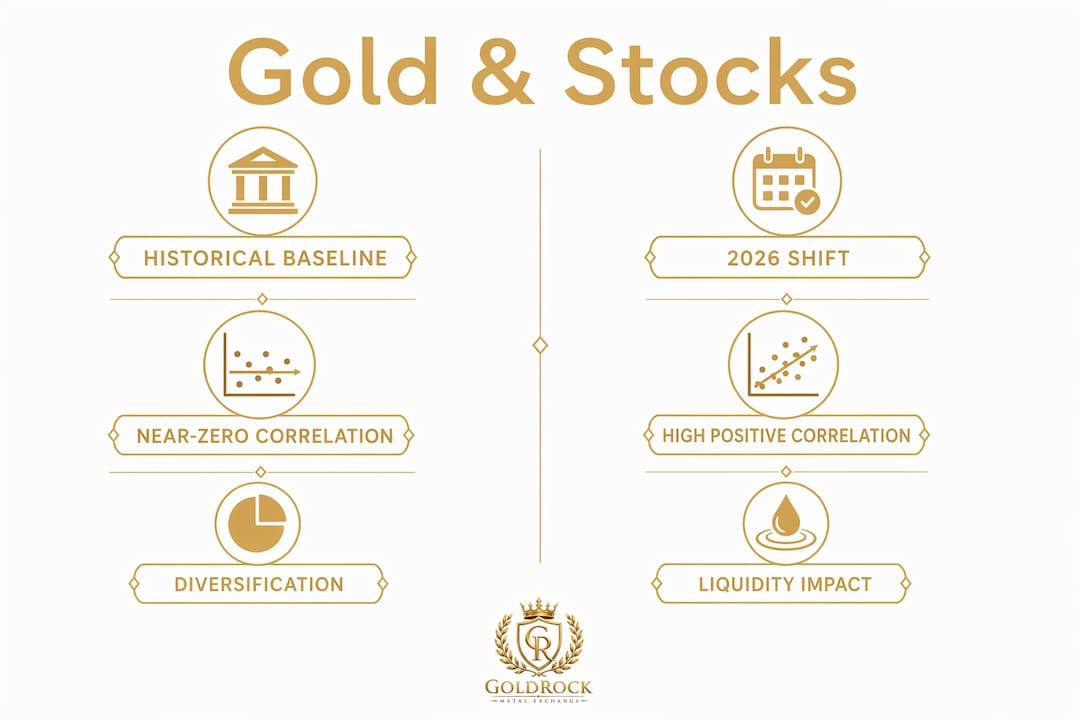
Gold’s long-term monthly return correlation to the S&P 500 has averaged between 0.00 and 0.09 since the 1970s. That figure is as close to zero as any major asset class gets. It means that, over decades, knowing what stocks did in a given month tells you almost nothing about what gold did.
That near-zero baseline is not an accident. Gold draws demand from jewelry buyers, central banks, industrial users, and investors simultaneously. Those demand sources respond to different economic forces, which is why gold’s diverse demand sources give it both cyclical and countercyclical characteristics that no other major asset replicates.
Early 2026 broke from that long-term pattern. The gold-stock correlation rose above 0.50, a level that signals meaningful co-movement rather than independence. That spike is temporary by historical standards, but it signals a structural shift worth understanding before you adjust your portfolio.

Pro Tip: Track the rolling 90-day correlation between gold and the S&P 500 using free tools from the World Gold Council. When that figure climbs above 0.40, treat your gold position as less of a hedge and size accordingly.
| Period | Gold-S&P 500 Correlation | Interpretation |
|---|---|---|
| 1970s to 2024 | ~0.00 to 0.09 | Near-zero, strong diversification signal |
| Early 2026 | Above 0.50 | Temporary pro-cyclical behavior |
| Post-geopolitical shock | Negative to low | Safe-haven demand drives gold higher |
How does gold behave when stocks fall sharply?
Gold’s behavior during equity drawdowns is where the relationship between gold and stocks becomes most useful for investors. During months when the S&P 500 dropped by more than 5%, gold delivered an average return of 2%. That positive return during negative equity months is the core of gold’s diversification case.
The impact of gold on stock market portfolios shows up most clearly in crisis periods. Following 12 major geopolitical risk events since 1990, gold prices rose an average of 4% in the month after the event. That 4% gain, occurring precisely when equity markets tend to sell off, reduces overall portfolio drawdown without requiring any active trading.
Three specific conditions drive gold’s defensive behavior:
- Equity market stress. When the S&P 500 falls sharply, investor capital rotates into gold as a store of value, pushing gold prices higher while stocks decline.
- Geopolitical uncertainty. Military conflicts, sanctions, and political instability all increase demand for physical gold as a currency-independent asset.
- Stock-bond correlation failure. In inflationary recessions, bonds and stocks can fall together. Gold’s low correlation with both assets provides crisis-proof portfolio protection when the traditional 60/40 model breaks down.
The practical implication is direct. A portfolio holding even a modest gold allocation absorbs less damage during equity crashes than a pure stock-and-bond portfolio. The role of precious metals in crisis periods is not theoretical. The return data from the past three decades confirms it.
What factors are changing the gold-stock relationship?
The traditional view of gold as a pure refuge asset, moving opposite to stocks, is giving way to something more complex. Analysts now describe the relationship as refuge to coexistence, where gold and equities can rise together when liquidity and fiscal policy expectations drive both markets simultaneously.
Several forces are reshaping the correlation of gold with equities right now:
- Liquidity-driven markets. When central banks inject liquidity or signal rate cuts, both stocks and gold benefit. The shared driver, not a shared economic cycle, causes the co-movement.
- Fiscal policy expectations. Large government deficits raise inflation expectations. That lifts gold as an inflation hedge while also supporting corporate earnings in nominal terms, pulling both assets higher together.
- Retail investor inflows. The late 2025 “debasement trade” brought a wave of retail buyers into gold ETFs and physical gold. Retail-driven inflows and electronic trading caused gold to behave more like a high-beta growth asset than a defensive one during that period.
- Algorithmic trading. Electronic trading platforms execute cross-asset momentum strategies that can force gold and stocks to move together in the short term, regardless of fundamental drivers.
The shift in gold and stock correlations reflects broader market liquidity and policy-driven environments rather than classic economic cycle relationships. That distinction matters because it means the correlation can reverse quickly once liquidity conditions change.
Pro Tip: When gold and stocks are rising together, check whether the driver is liquidity or genuine safe-haven demand. If it is liquidity, the correlation will likely revert to its historical near-zero level once monetary conditions tighten.
How can investors use gold-stock correlation in their portfolios?
Understanding the gold price and stock market relationship is only useful if it changes how you build and manage your portfolio. Four practical applications stand out.
-
Use gold as a diversifier, not a bond substitute. Gold has historically exhibited twice the volatility of government bonds over a 10-year period. That higher volatility means gold does not replace bonds in a portfolio. It complements them by providing a different type of risk exposure that bonds cannot replicate.
-
Monitor the S&P 500-to-gold price ratio. The S&P 500 price relative to gold is a signal institutional investors watch closely. When this ratio breaks below its seven-year average, it has historically signaled tougher conditions ahead for equities. Investors who track this ratio get an early warning that gold may be entering a period of relative outperformance.
-
Adjust gold allocation when correlation spikes. When the gold-stock correlation rises above 0.40, the diversification benefit shrinks. Reducing gold exposure slightly during high-correlation periods and rebuilding it when correlation returns to near zero preserves the portfolio benefit without abandoning the asset class.
-
Size gold positions with volatility in mind. Because gold carries more volatility than bonds, a volatility-adjusted allocation will typically be smaller than a simple percentage-of-portfolio approach suggests. Matching the risk contribution of gold to that of other portfolio assets produces a more balanced outcome.
Gold investment vs stock investment is not an either-or decision. The two assets serve different functions. Stocks drive long-term wealth growth. Gold reduces the severity of drawdowns and protects purchasing power during inflationary periods. Holding both, sized correctly, produces a portfolio that performs across a wider range of economic conditions than either asset alone.
Investors who want exposure to gold investment products ranging from physical bullion to precious metals IRAs have more options today than at any point in the past decade.
Key Takeaways
Gold’s near-zero long-term correlation with the S&P 500 makes it the most reliable large-scale diversifier available to equity investors, though recent liquidity-driven spikes above 0.50 require active monitoring.
| Point | Details |
|---|---|
| Long-term correlation near zero | Gold’s monthly correlation to the S&P 500 has averaged 0.00 to 0.09 since the 1970s. |
| Defensive during drawdowns | Gold averaged a 2% return in months when the S&P 500 fell more than 5%. |
| Geopolitical safe haven | Gold rose an average of 4% in the month following major geopolitical shocks since 1990. |
| Correlation can spike temporarily | Early 2026 saw gold-stock correlation exceed 0.50, driven by liquidity and retail inflows. |
| Not a bond replacement | Gold carries roughly twice the volatility of government bonds, requiring careful position sizing. |
Gold’s shifting role: what the 2026 data is really telling us
The spike in gold-stock correlation above 0.50 in early 2026 surprised a lot of investors who had treated gold as a permanent hedge. My honest read is that the surprise itself reveals a gap in how most investors understand the asset.
Gold has never been a simple inverse of the stock market. It has always been driven by a mix of forces, some of which align with equity markets and some of which oppose them. What changed recently is the weight of those forces. Retail inflows, algorithmic momentum trading, and a shared liquidity environment pushed gold and stocks in the same direction for an extended period. That is not a failure of gold. It is a feature of modern markets that every investor needs to account for.
The investors who got caught off guard were those who bought gold expecting it to automatically fall when stocks rise and rise when stocks fall. That mechanical inverse relationship has never been reliable over short periods. What has been reliable, across five decades of data, is the near-zero long-term correlation. That is the property worth owning.
My advice is to treat the current high-correlation period as a calibration opportunity. Use it to review your allocation, check your volatility exposure, and make sure you understand why you hold gold. If your answer is “because it always goes up when stocks go down,” you need to revisit the thesis. If your answer is “because it reduces long-term portfolio volatility and protects against scenarios where both stocks and bonds fail,” you are on solid ground.
— Blake
Goldrockmetalexchange: physical gold and precious metals for serious investors
Investors who understand the gold price and stock market relationship know that owning gold in theory and owning it in practice are two different things.

Goldrockmetalexchange offers physical gold, silver, platinum, and palladium for direct purchase, along with self-directed precious metals IRAs that let you hold physical gold inside a tax-advantaged retirement account. The in-house IRA department handles the transfer process from start to finish, removing the friction that keeps most investors from acting. For investors who want to understand the full range of options before committing, the GoldRock education center covers gold’s market behavior, historical performance, and portfolio construction in plain language. Every purchase comes with insured private delivery and ongoing consultation support.
FAQ
What is the typical correlation between gold and the S&P 500?
Gold’s long-term monthly correlation to the S&P 500 has averaged between 0.00 and 0.09 since the 1970s. That near-zero figure makes gold one of the most effective diversifiers available to equity investors.
Does gold perform better than stocks during a market crash?
Gold does not always outperform stocks in absolute terms, but it consistently delivers positive or flat returns when stocks fall sharply. During months when the S&P 500 dropped more than 5%, gold averaged a 2% return.
Why did gold and stocks move together in early 2026?
The gold-stock correlation rose above 0.50 in early 2026 due to shared liquidity conditions, fiscal policy expectations, and retail investor inflows during the “debasement trade.” This pro-cyclical behavior is temporary by historical standards.
Can gold replace bonds in a portfolio?
Gold cannot replace bonds directly because it carries roughly twice the volatility of government bonds over a 10-year period. Gold complements bonds by providing a different risk profile, particularly during inflationary recessions when bonds and stocks fall together.
What is the S&P 500-to-gold ratio and why does it matter?
The S&P 500-to-gold ratio measures the price of the index relative to the price of gold. When this ratio falls below its seven-year average, it has historically signaled bearish conditions for equities and relative strength in gold.