
The consensus silver price outlook for 2026 points to a wide but meaningful range, with institutional forecasts spanning a wide range including values below and above $80 per ounce. Some analysts cited in a June 2026 Yahoo Finance roundup expect silver to surpass $80/oz by year-end, while other major banks place their average forecast in the mid-$50s. That spread is not noise. It reflects genuine disagreement about how fast industrial demand accelerates, whether the Federal Reserve cuts rates meaningfully, and how quickly above-ground stocks continue to erode.
Silver’s dual identity as both an industrial metal and a monetary asset means it can respond to two completely different sets of catalysts at once — and in 2026, both are active.
Three immediate implications for investors:
- Volatility is elevated. A wide spread between bear and bull forecasts means position sizing matters more than entry timing.
- Allocation deserves a look. With six consecutive years of structural supply-demand deficit documented by the World Silver Survey 2026, the structural case for silver is stronger than at any point in the prior decade.
- Watch three indicators first: SLV ETF holdings, COMEX registered inventories, and the CFTC Commitments of Traders (COT) net speculative position. These three tell you whether money is moving toward or away from silver before price confirms it.
The sections below cover institutional forecasts in detail, the primary drivers for 2026, three explicit scenarios with price ranges, a full indicator watchlist, and practical positioning options for U.S. investors including physical silver and Precious Metals IRAs.
Key Takeaways
The 2026 silver market presents a structurally supported but scenario-dependent outlook, with institutional forecasts spanning a wide range depending on Fed policy, industrial demand, and ETF flows.
| Point | Details |
|---|---|
| Forecast range is wide | Institutional views span a wide price range; some analysts project prices above $80/oz by year-end 2026. |
| Six-year supply deficit | The World Silver Survey 2026 documents multiple consecutive years of structural deficit, thinning above-ground stocks and amplifying price moves. |
| Industrial demand is 60% of total | J.P. Morgan quantifies industrial applications at roughly 60% of silver demand, making manufacturing cycles and green-energy adoption critical price drivers. |
| Three scenarios, three price ranges | Bear, base, and bull scenarios cover different price ranges tied to specific macro catalysts, reflecting a broad range of potential outcomes. |
| Watch SLV, COMEX, and COT weekly | These three indicators together give the earliest signal of whether money is moving toward or away from silver before price confirms it. |
Outlook last updated: mid-2026. Review quarterly or after major Fed policy changes.
Request a Free Precious Metals Consultation or call (888) 859-0978.
Table of Contents
- What major institutions are forecasting for silver in 2026
- What is actually driving silver prices in 2026
- Bear, base, and bull scenarios for silver in 2026
- Which indicators should you watch through 2026?
- How U.S. investors can position for the 2026 silver market
- Ready to act? GoldRock Metal Exchange can help
- An editorial perspective on 2026 silver positioning
- Primary sources and further reading
- Sources
What major institutions are forecasting for silver in 2026
Institutional forecasts for the silver market in 2026 show significant dispersion compared to prior years. That divergence itself is informative: it signals that the outcome hinges on a small number of binary macro decisions, particularly Fed policy and global manufacturing momentum.
J.P. Morgan’s commodity research frames silver as a hybrid metal, with roughly 60% of demand coming from industrial applications — which means its price path in 2026 depends as much on factory output and solar panel installations as on safe-haven flows.
Goldman Sachs has maintained a constructive view on precious metals broadly, citing real-rate compression and central bank diversification away from dollar assets as structural tailwinds. Their silver outlook for 2026 aligns with the higher end of the institutional range, supported by persistent industrial demand from photovoltaics and electronics. J.P. Morgan’s research notes the industrial demand concentration as both an upside driver in a growth scenario and a vulnerability if manufacturing PMIs deteriorate.
Sprott’s 2026 outlook highlights the macro case: dollar weakness, elevated geopolitical risk, and investor demand for hard assets as portfolio hedges. Sprott’s framing is explicitly allocation-oriented, positioning silver alongside gold as a core holding for investors concerned about currency debasement and equity concentration risk.
| Institution | 2026 Forecast Basis | Headline View | Primary Driver Cited |
|---|---|---|---|
| J.P. Morgan | Industrial demand model | Constructive; industrial sensitivity key | Photovoltaics, EV supply chains |
| Goldman Sachs | Macro/rates model | Bullish; real-rate compression | Fed policy, dollar weakness |
| Sprott | Allocation/macro | Bullish; hard-asset demand | Geopolitical risk, currency hedging |
| Yahoo Finance consensus | Analyst aggregation | Some forecasts above $80/oz by year-end | Industrial + investment demand |
One important distinction: some forecasts represent annual averages while others are year-end targets or peak projections. A forecast of $80/oz as a year-end target is materially different from an $80/oz annual average. When you read a headline number, always check which metric it describes.
What is actually driving silver prices in 2026
Silver’s price in 2026 is being shaped by forces on both sides of the ledger simultaneously. Understanding which driver dominates in a given quarter is what separates a reactive investor from a prepared one.
Supply: a market already running short
The World Silver Survey 2026 documents six consecutive years of structural supply-demand deficit. Mine production has not kept pace with demand growth, and above-ground stocks have been drawn down year after year. That cumulative drawdown matters because it reduces the buffer that normally absorbs demand spikes. When investment demand surges, there is less slack in the system to absorb it, which amplifies price moves in both directions.

Refinery output has been broadly stable, but it cannot manufacture silver that was not mined. Primary silver mines face rising extraction costs and longer permitting timelines, and a meaningful portion of global silver supply comes as a byproduct of copper, lead, and zinc mining. When base metal prices fall and those mines curtail output, silver supply tightens as a secondary effect.
Industrial demand: photovoltaics, EVs, and electronics
J.P. Morgan’s research quantifies the industrial share of silver demand at roughly 60%. That figure is the single most important number for understanding silver’s 2026 price behavior. Solar panel manufacturing (photovoltaics) is the fastest-growing component of that industrial demand. Each solar panel uses silver paste as a conductor, and global solar installation capacity has expanded sharply. EV production adds another demand layer through electrical contacts and battery management systems.
Because roughly 60% of silver demand is industrial, a slowdown in global manufacturing hits silver harder than it hits gold — but a green-energy acceleration lifts it disproportionately.
Electronics demand, from semiconductors to medical devices, adds a base load of industrial consumption that is relatively inelastic. Even in a mild recession scenario, electronics production does not collapse.
Investment and ETF flows
Investment demand is the swing factor. When real interest rates fall or dollar confidence erodes, investors move into silver ETFs and physical metal. SLV (iShares Silver Trust) holdings are the most-watched proxy for this flow. A sustained increase in SLV holdings alongside rising COMEX open interest typically precedes a price move. Retail coin and bar demand, tracked through U.S. Mint sales data, adds another layer of investment demand that tends to spike during periods of financial stress.
Macro drivers: real rates, the dollar, and global growth
Silver is priced in dollars, so dollar strength directly compresses prices for non-U.S. buyers. When the USD index rises, silver becomes more expensive in local currencies, which suppresses demand at the margin. Conversely, a weaker dollar in 2026 would be a tailwind.
Real interest rates (nominal rates minus inflation expectations) are the other key macro variable. Silver, like gold, carries no yield. When real rates are low or negative, the opportunity cost of holding silver falls, making it more attractive relative to bonds. The Fed’s rate path through 2026 is therefore a direct input into the silver price forecast.
Global GDP growth and manufacturing PMIs matter because of that 60% industrial demand share. A synchronized global slowdown would weigh on silver more than on gold. A manufacturing recovery, particularly in Asia, would support it.
Geopolitical and technology catalysts
Trade disruptions, sanctions on major mining jurisdictions, and supply-chain fragmentation can create sudden tightness in physical silver markets. Green-energy policy acceleration, particularly in the U.S. and EU, directly increases photovoltaic demand and therefore silver consumption. These are not slow-moving trends. A single large-scale solar procurement announcement can shift the demand picture materially within a quarter.
Pro Tip: When supply-side data (COMEX inventory draws) and demand-side data (ETF inflows) are both moving in the same direction, that convergence is a stronger signal than either indicator alone. Divergence between the two usually means the market is in a transitional phase where patience pays more than action.
Bear, base, and bull scenarios for silver in 2026
The wide institutional forecast range reflects three genuinely different macro paths. Each scenario has a distinct set of catalysts and a price range tied to them.
Bear scenario: A lower price range well below $40/oz
The bear case requires a combination of sustained high real rates and a meaningful global manufacturing slowdown. If the Fed delays cuts into late 2026 and manufacturing PMIs in the U.S., Europe, and China all contract simultaneously, industrial demand softens while investment demand stays muted. Dollar strength compounds the pressure. The structural supply deficit provides a floor, but it does not prevent a significant drawdown from current levels if investment flows reverse.
Base scenario: A mid-level price range below $70/oz
The base case assumes the Fed delivers moderate rate cuts in the first half of 2026, global manufacturing stabilizes, and the structural supply deficit continues to support prices. Industrial demand from photovoltaics and electronics grows at a steady pace. ETF holdings are flat to modestly higher. This is the scenario most institutional forecasts cluster around, though the range within it is still wide.
Bull scenario: A high price range potentially exceeding $75/oz
The bull case requires at least two of three catalysts to fire simultaneously: aggressive monetary easing, a green-energy demand acceleration, and a supply shock (mine disruption, refinery outage, or geopolitical disruption to a major producing country). The Yahoo Finance analyst roundup captures this view, with some experts projecting silver above $80/oz by year-end 2026 and potential upside to $100/oz by 2030. The six-year supply deficit documented by the World Silver Survey means above-ground stocks are thin enough that a demand surge would hit a market with limited buffer.
Key catalysts to monitor that could shift probability between scenarios:
- Federal Reserve meeting outcomes and dot-plot revisions (January, March, June 2026)
- Global manufacturing PMI readings (monthly, particularly China Caixin and U.S. ISM)
- SLV and other silver ETF holdings (weekly)
- COMEX registered silver inventories (daily)
- Major solar and EV procurement announcements
- Geopolitical developments affecting Peru, Mexico, or China (top silver-producing regions)
Which indicators should you watch through 2026?
Tracking the right data points weekly and monthly is what keeps a forecast useful rather than static. The indicators below are the ones institutional desks actually use to calibrate their silver views.
- SLV ETF holdings: Published daily by iShares. Rising holdings signal institutional and retail investment demand building. A sustained multi-week increase alongside flat or falling COMEX inventories is one of the strongest pre-price signals in the silver market.
- COMEX registered inventories: Available daily through CME Group. Registered inventory is silver available for delivery against futures contracts. When it falls sharply, it signals physical tightness and can trigger short squeezes.
- CFTC Commitments of Traders (COT) report: Published weekly, every Friday, covering positions as of the prior Tuesday. The net speculative long position in silver futures tells you how much momentum money is already in the trade. Extremely high net longs are a contrarian warning; low or net-short positioning is a setup for a sharp rally if a catalyst fires.
- Real yields (10-year TIPS yield): Available daily from the U.S. Treasury. The single most reliable macro input for precious metals pricing. Falling real yields are bullish for silver; rising real yields are bearish.
- USD index (DXY): Tracks the dollar against a basket of major currencies. Silver and the DXY have a strong inverse relationship. Watch for sustained moves above 108 (bearish for silver) or below 98 (bullish).
- Manufacturing PMIs: ISM Manufacturing (U.S., monthly) and Caixin PMI (China, monthly). Readings above 50 signal expansion and support industrial silver demand; below 50 signal contraction.
- Silver lease rates and premiums: Less widely tracked but highly informative. Rising lease rates signal tightness in the physical lending market. Wide premiums on physical silver over spot indicate retail demand pressure.
Pro Tip: Set a weekly calendar reminder to check COMEX inventories and SLV holdings together. When both move in the same direction for three consecutive weeks, it is worth reviewing your position sizing against the scenario framework above.
How U.S. investors can position for the 2026 silver market
The forecast range and scenario analysis above are only useful if they connect to actual portfolio decisions. For U.S. investors, there are five primary ways to gain silver exposure, each with a distinct risk and cost profile.
Physical silver bullion
Buying physical silver bars or coins gives you direct ownership of the metal with no counterparty risk. The tradeoff is storage, insurance, and the bid-ask spread on physical products. For investors who want the metal itself, this is the most direct path. The silver buying process involves selecting a product (coins, rounds, or bars), completing a purchase, and arranging insured delivery or secure storage.
Physical silver is also the foundation of a self-directed Precious Metals IRA, which allows retirement funds to hold IRS-approved silver products in a qualified custodial account.
Silver ETFs
ETFs like SLV (iShares Silver Trust) offer liquid, exchange-traded exposure without the logistics of physical ownership. They are easy to buy and sell through any brokerage account. The tradeoff: you hold a paper claim on silver, not the metal itself, and ETF shares are subject to management fees and counterparty risk from the fund structure.
Futures and derivatives
COMEX silver futures offer leveraged exposure and are the primary price-discovery mechanism for the global silver market. They are appropriate for sophisticated investors with active risk management. Margin requirements and daily mark-to-market settlements make futures unsuitable for most long-term investors.
Mining equities
Silver mining stocks offer leveraged exposure to silver prices, since a miner’s profit margin expands disproportionately when silver rises above its all-in sustaining cost. The tradeoff is operational risk: mine disruptions, management decisions, and jurisdiction risk can cause a mining stock to underperform even when silver itself rises.
Self-directed Precious Metals IRAs
A self-directed Precious Metals IRA allows U.S. investors to hold IRS-approved physical silver within a tax-advantaged retirement account. The IRS requires that the metal be held by an approved third-party custodian, not in personal possession. Eligible silver products include certain coins and bars meeting IRS purity standards (generally .999 fine or better). This structure combines the inflation-hedging and portfolio-diversification properties of physical silver with the tax treatment of a traditional or Roth IRA.
Precious metals in a self-directed IRA must be held by an IRS-approved custodian. Personal possession of IRA-owned metals is a prohibited transaction under IRS rules and triggers immediate tax consequences. Always confirm custodian eligibility before initiating a rollover.
| Exposure Method | Liquidity | Storage/Custody | IRA-Eligible | Key Cost Driver |
|---|---|---|---|---|
| Physical bullion | Low-medium | Required (home or vault) | Yes (via SDIRA) | Premiums, storage, insurance |
| Silver ETFs | High | None (brokerage) | Yes (standard IRA) | Management fee, bid-ask spread |
| Futures | Very high | None | No | Margin, rollover costs |
| Mining equities | High | None (brokerage) | Yes (standard IRA) | Operational/management risk |
| Self-directed Precious Metals IRA | Low-medium | Required (IRS-approved custodian) | Yes (by definition) | Custodian fees, dealer premiums |
For risk sizing: given the wide bear-to-bull range discussed above, investors who cannot tolerate a substantial drawdown from a bull-case entry should size their silver allocation accordingly. Silver is a volatile asset. The portfolio risk reduction case for precious metals rests on correlation benefits and inflation sensitivity, not on silver being a low-volatility holding.
For investors exploring silver as an inflation hedge, the structural supply deficit and industrial demand growth make 2026 a more compelling entry context than most prior years. That said, this article is educational and does not constitute personalized investment, tax, or legal advice. Consult a qualified financial advisor before making allocation decisions.
Ready to act? GoldRock Metal Exchange can help

GoldRock Metal Exchange is a full-service precious metals dealer serving U.S. investors who want direct access to physical silver, insured private delivery, and in-house support for self-directed Precious Metals IRAs. Whether you are buying your first silver bar or rolling over a 401(k) into a Precious Metals IRA, GoldRock’s in-house IRA department handles the process from account setup through metal selection and custodial transfer.
A free consultation with GoldRock covers:
- Current silver market outlook and how it relates to your portfolio goals
- Physical silver product options (coins, rounds, bars) and current live pricing
- Insured private delivery logistics and storage considerations
- Self-directed IRA rollover steps, eligible products, and custodian requirements
- Educational resources on silver’s role in a diversified portfolio
GoldRock does not provide personalized tax or legal advice. All consultations are educational and designed to help you understand your options before making any decision.
Request a Free Precious Metals Consultation or call (888) 859-0978.
An editorial perspective on 2026 silver positioning
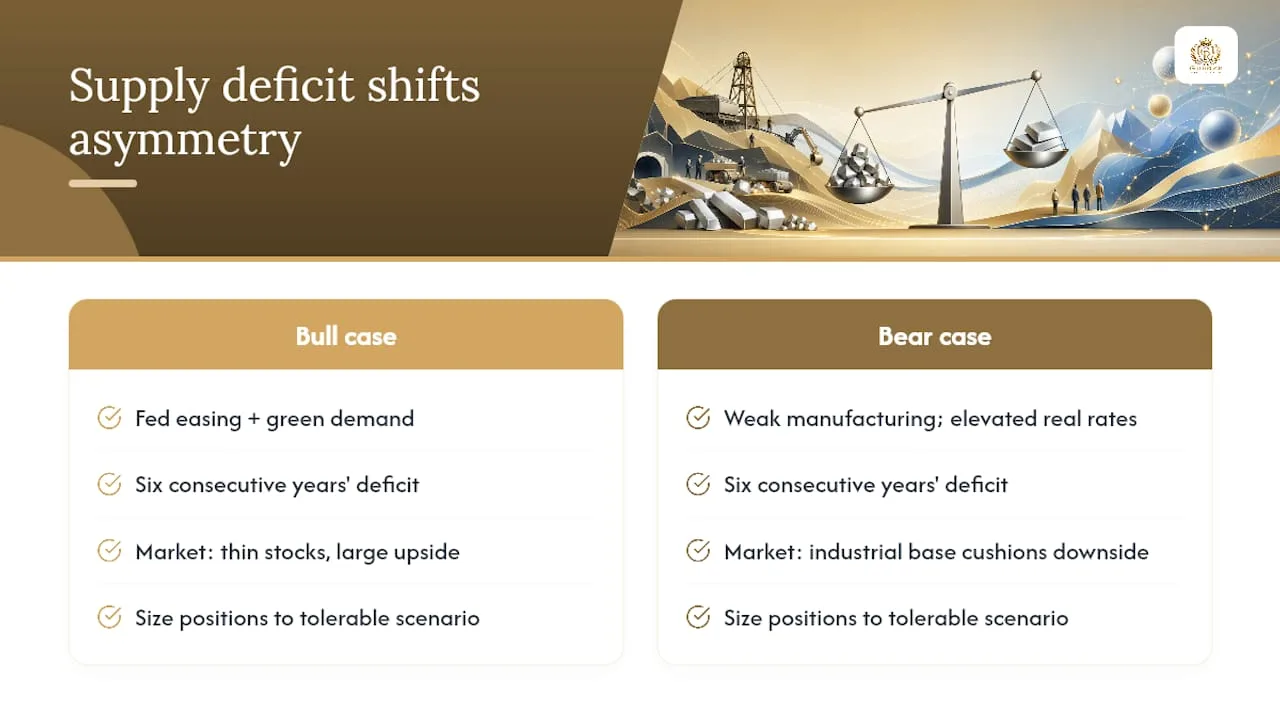
The most underappreciated aspect of the 2026 silver market is not the bull case. It is the structural floor that six consecutive years of supply deficit has built beneath prices. Most commodity markets self-correct: high prices incentivize new supply, which brings prices back down. Silver’s supply response has been unusually slow, partly because a large share of it is byproduct mining that responds to base metal economics, not silver economics. That structural feature changes the risk profile of holding silver in a way that most investors have not fully priced in.
The wide institutional forecast range is not a sign that analysts are confused. It reflects the genuine binary nature of the macro setup: if the Fed eases aggressively and green-energy demand continues to accelerate, the bull case is not unreasonable. If manufacturing stalls and real rates stay elevated, the bear case is equally defensible. What the supply deficit does is shift the asymmetry. A demand surge hits a market with thin above-ground stocks. A demand contraction hits a market where industrial consumption provides a base load that does not disappear.
For U.S. investors, the practical implication is that silver deserves a place in a diversified portfolio not because the bull case is certain, but because the structural setup makes the downside more bounded and the upside more open than the headline volatility suggests. Position sizing to the scenario you can live with, not the scenario you hope for, is the discipline that actually protects wealth over time.
This article is informational and educational. It does not constitute personalized financial, tax, or legal advice. Consult a qualified financial advisor, tax professional, or attorney before making investment decisions.
Primary sources and further reading
Use these sources to verify the numbers in this article and to track the market as 2026 unfolds.
- World Silver Survey 2026 (Silver Institute) — The definitive annual supply-demand balance for global silver. Updated annually; the 2026 edition documents the sixth consecutive supply deficit and above-ground stock drawdown.
- J.P. Morgan silver research — Institutional commodity research covering silver’s demand composition, industrial sensitivity, and price drivers. Updated periodically; check for the most recent note.
- Sprott Gold & Silver Outlook 2026 — Investor-focused macro perspective on gold and silver for 2026, covering allocation rationale and institutional sentiment.
- Yahoo Finance silver price predictions roundup — Aggregated analyst forecasts and commentary, useful for mapping the consensus range quickly. Published June 2026.
- CFTC Commitments of Traders (CFTC.gov) — Weekly speculative and commercial positioning in silver futures. Published every Friday; covers positions as of the prior Tuesday.
- SLV holdings (iShares.com, search “SLV fund details”) — Daily ETF holdings data showing investment demand flows into silver. Free to access; update daily.
- COMEX silver inventories (CME Group, cmegroup.com) — Daily registered and eligible silver inventory available for futures delivery. The registered figure is the most relevant for physical tightness analysis.
- Chase: Why Invest — High-level investor education on asset allocation and the role of alternative assets; useful background for investors new to precious metals as a portfolio component.
This article is general information, not a substitute for advice from a qualified financial advisor. Consult a qualified financial professional about your own circumstances before acting on anything here.
Sources
Transparency about sources and methods matters when the forecast range spans $70/oz. Here is what went into this outlook and where to verify the numbers yourself.
Methodology:
- Silver price predictions: What can investors expect over the next 10 years?
- Gold & Silver Outlook 2026
- Silver prices
- World Silver Survey 2026
- Why invest? (Chase)
Data vintage: All figures and source documents referenced in this article reflect data available as of mid-2026. The World Silver Survey 2026 is the primary supply-demand source.
Update frequency: The scenario framework should be revisited quarterly or after any major Fed policy announcement, significant ETF flow shift, or geopolitical event affecting major silver-producing countries.
Limitations: All forecasts are conditional on the macro assumptions stated in each scenario. Silver is a volatile market and actual prices can deviate sharply from any model. This outlook is informational only and does not constitute a guarantee of any price outcome.